I’ve recently had the opportunity to lead on measuring aspects of the developer experience of my engineering organization. Specifically, I focused on how efficiently we deliver software to our customers and what the experience around delivering software looks like for the engineers.
I think the rationale is common to many organizations: delivering software to our customers is critical to our business so we want to continuously review and ensure it’s as smooth as possible.
Learning from the DevEx study I took a bilateral approach: I identified objective metrics that I could retrieve from our delivery pipelines and then I crafted specific surveys to assess the perception of the people working with those pipelines. Then, I reconciled the perception coming from the surveys with the data coming directly from the delivery pipelines to better understand what work to prioritize to improve the status quo.
Understanding Developer Experience
First of all, since it’s foundational to this analysis, let’s review what the DevEx study says regarding developer productivity.
By showing that developer engagement, satisfaction, and productivity increase the productivity of software organizations, the DevEx study identifies three main aspects to the experience: feedback loops, flow and cognitive load.
Feedback loops are essential to any high performing organization. Having feedback loops that help people validate their assumptions and course correct accordingly will impact considerably their ability to deliver value.
Flow is a crucial aspect to software development: a flow state means developers are fully focused and engaged in what they are doing. Studies demonstrate how impactful this state of consciousness is to developers.
Cognitive load, then, is the amount of knowledge a single developer needs to hold to be able to perform their daily job. High amounts of cognitive load will easily exhaust developers easily and make it hard to retain a flow state.h
With those definitions in mind, then, I set out to better understand what aspects of delivering software we could measure via specific metrics and what other aspects to assess via surveys.
Identifying Key Metrics
The use of surveys, as recommended by the DevEx study, helps getting a sense for the perception that people have towards what you are interested in. Coupling data around the perception with objective metrics coming from your delivery pipelines helps you better understand on what to focus on.
Let’s explore together what metrics I focused on for our delivery pipelines.
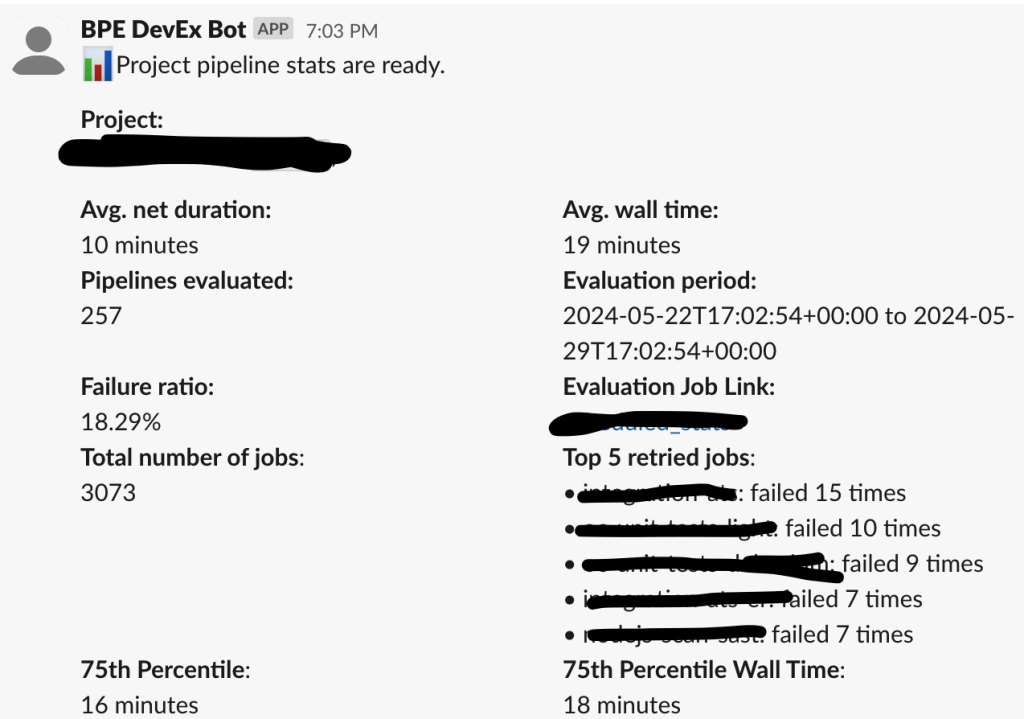
For this purpose I wrote a little Ruby script to collect the data that I report on, on a monthly basis. Additionally, the script runs on more granular intervals and reports findings into Slack so that teams can promptly identify issues.
For the monthly cadence, the main data points I focus on are as follows.
Number of pipelines executed in the selected time range: this gives us an indication of usage throughout the selected time period: usage might vary because of external factors like more holidays in the time period or more work getting delivered. In general it is useful to take the number of pipelines into account when validating the variations of failure rate and duration over time. As the number of pipelines increases we might want to understand, for example, whether teams are delivering more or whether they are forced to kick off pipelines more often due to their high failure rate.
Pipeline failure rate: this metric provides an indication of how smooth the delivery experience is. A pipeline failure can include failing tests, issues with external dependencies, problems with the target delivery environment, or issues with the underlying SDLC pipeline provider. Monitoring the failure rate helps identify and address bottlenecks or recurring issues.
75th percentile duration: This is likely the main metric to focus on when it comes to improving the delivery experience. It represents the end-to-end duration of your pipeline from the moment a change is checked into the main branch to when it gets released to customers. Focusing on the 75th percentile helps optimize for outliers due to current architecture, but you can choose how best to represent this metric for your context.
75th percentile wall time duration: This is the total time from kickoff to completion, including potential wait time due to e.g. job runners being saturated. It provides insight into any delays caused by resource contention or aspects that are not necessarily connected to the specific build pipeline definition.
Test flakiness rate: This measures how often tests produce unreliable results. Flaky tests can significantly impact the developer experience and pipeline reliability. Including this metric in your measurements ensures a focus on reducing flakiness, which can improve overall stability and confidence in the pipeline.
Pipeline costs: I highly recommend to include cost measures in your data. Direct pipeline costs should be part of your decision making if you don’t want surprises in your bills later.
Once you have consolidated your set of metrics it’s important to take note of them on a recurring basis and be able to look at them retrospectively.
I recommend different cadences when it comes to collecting and retrospectively analyzing the metrics. Surely, a monthly overview will give you a more coarse indication of whether things are improving or not and whether the measures you might have put in place are being effective.
Additionally, you might want more granular reviews of your metrics. For example, a 7-day rolling view of your daily pipeline metrics might help you catch issues early.
Additionally, I recommend integrating your findings into your daily communication tool of choice. For example, I added a Slack integration to my scripts in order to promptly alert teams and individuals about the latest stats.
Using surveys to gauge perception
Once you have a basic set of metrics to report on, you will want to integrate your observations with the perception from the people working with the delivery pipelines on a daily basis.
The survey should help you better understand the aspects of the experience you cannot directly measure. For example, highly complex delivery pipelines might make it harder to the engineers to understand how when their code gets into production. In our case we have a complex monolith that serves the majority of the business logic and that requires a complex delivery architecture.
Such complexity might not be apparent from the metrics you collect directly from the delivery pipeline but you might get a sense for it from specific survey questions.
I structured the surveys as a series of statements that can be answered with one of the following: strongly agree, somewhat agree, somewhat disagree, strongly disagree.
Here are a few sample statements you can use in yours.
1. I cannot run the tests for my project on my local machine: I need to push my changes to a remote branch so that our delivery pipelines can do it for me.
Answers to this statement helps me assess the impact on flow: having to push to remote to run tests clearly indicates that there’s significant interruption throughout the work as part of the validation feedback loop. In this case pipeline speed represent a critical aspect for the team’s productivity.
2. At any point I can confirm with confidence whether my changes are deployed and running in production.
This statement gives me a feeling for the complexity of the delivery architecture. Any indication of friction or complexity in retrieving such a simple piece of information like the exact version of the software running in production means that the cognitive load of the developers is impacted. Fine-tune this type of statements to your needs in order to identify sources of friction to remove.
3. When a master pipeline fails the relevant recovery process will kick off straight away.
This question does not directly correlate to the DevEx study recommendations but it gives you an indication of the health of your delivery organization. If you don’t have clear ownership around pipeline failures this statement might collect many disagree responses.
4. The main delivery pipeline failures are rare and do not represent the norm.
This helps you reconcile the data you get from the pipelines themselves with the experience as perceived by the developers. You might have a high pipeline failure rate but engineers might still feel failures are rare. This could be further confirmation of the assessment from the previous statement. If checking code into the main branch is a fire and forget type of activity, any subsequent failures might not even get noticed by the developers.
5. Once my changes are checked in they will be delivered to production in reasonable time.
You can use this statement to assess the perception of pipeline delivery time of the engineers in the team. Some might be satisfied, others may be unhappy with the current times. You’ll hardly find consensus with this one but it’s an important one to use as a basis for a conversation. Some will take into account other sources of complexity like your testing pyramid, your deployment cadence and the type of business you are in and will not just look at delivery time alone.
This is just a sample set of questions and you should make sure they apply to your organization. What’s important is that you have a sentiment counterpart to the data you are collecting via direct pipeline metrics, so that you can have a further dimension to help your decision making later on.
Remember you’ll hardly get the survey right the first time but it’s important to collect feedback about it and iterate. I recommend collecting survey responses multiple times a year, trying to improve your questions each time.
Follow up actions
Acting on the data you have collected is the next step. I recommend meeting with the leaders of your organization to discuss your findings and understand if what you have collected makes sense and is reflected by anecdotal observations.
Then, use the data to be able to set targets and kick off initiatives. For example, flaky tests might be a low hanging fruit to tackle now, but longer term a more profound restructuring of how your teams approach tests might be the right way to go.
The actions you want to take on might not all be related to specific data points. The surveys might have surfaced that you have a culture problem in your organization so you might want to focus on initiatives that facilitate change in that regard.
Conclusion
By systematically measuring both objective pipeline metrics and subjective developer perceptions, organizations can gain a holistic view of their software delivery process. This dual approach not only highlights areas for improvement but also ensures that the changes made will positively impact developer satisfaction and productivity. Regularly revisiting these metrics and survey results will keep the focus on continuous improvement, ultimately leading to a more efficient and enjoyable developer experience.
Leave a Reply